- HTML
- Bootstrap
- JS
- jQuery
- Angular 1
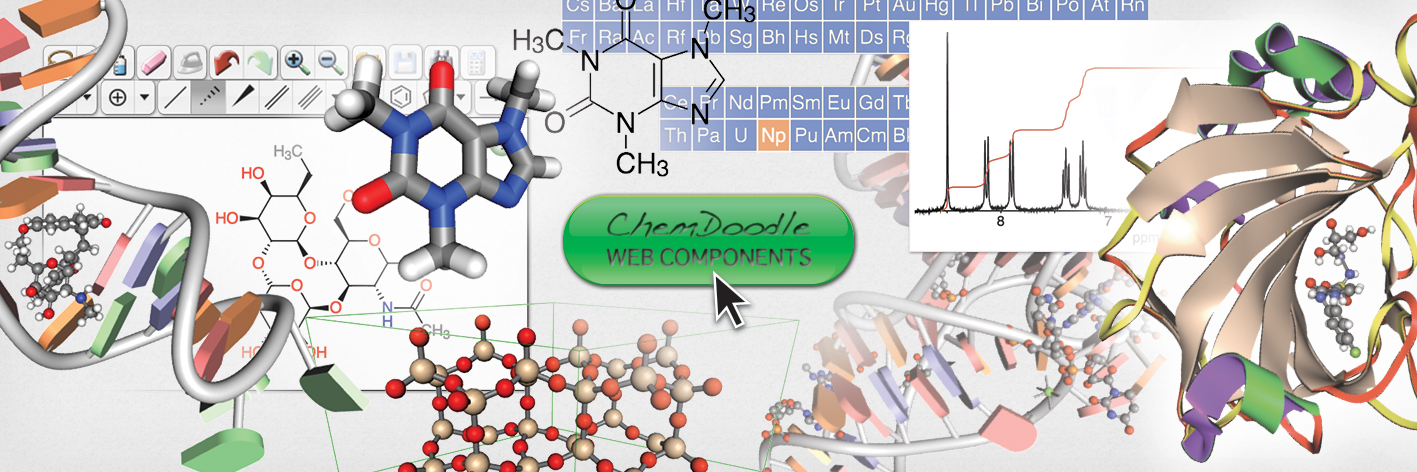
- ChemDoodle
June 15, 2014
Introduction
Lab3D was a requirement of my Master's in Biomedical Communications (MScBMC). A MScBMC is a professional degree in the visual communication of science. The goal of the project was to develop a platform showcasing visualizations of organic chemistry reaction taught at the undergraduate level.
A significant challenge in learning chemistry is that the main characters are invisible to the eye, can only be "observed" with powerful instrumentation. A number of styles of representing chemical data have emerged as a result, and it ultimately falls to the student to cognitively assemble multiple layers of data into a "whole picture". It's been shown that a difference between "experts" and "beginners" in chemistry is this visualization capacity, however there are few scientific artists working in chemistry education compared to biology and medicine to help develop this capacity. A few notable exceptions:
- the 1948 "Architecture of Molecules" book of molecular illustrations by Roger Hayward and Linus Pauling
- David Goodsell's cellular-level watercolour paintings
- the Science Vis laboratory recently formed at the University of Toronto that focusses on creating and testing visualizations of the molecular level
My goal for Lab3D was to combine synchronized, multiple representations of chemical reactions in a single view. For each reaction there is an overall reaction word and Lewis structure equations, a 3D interactive animation, a reaction coordinate graph, and textual descriptions. In this way students would be able to compare and contrast multiple representations simultaneously and, hopefully, better form a mental model of the whole.
Approach
I looked at creating an ebook with iBooks author, but ultimately preferred the web as a platform because of the number of tools I could leverage and because it enabled broader distribution. To display molecular graphics I used ChemDoodle Web Components (CWC), a javascript library for chemical graphics, interfaces and informatics. Following the conclusion of this project I wrote a review of CWC which was published in the Journal of Cheminformatics (Figure 1).
Challenges
1My web development experience up to that point was in elementary school with Geocities, basically viewing source and copying code. In order to build Lab3D v1 I took a course in javascript that followed Marijn Haverbeke's "Eloquent Javascript", and read blog posts and other books to learn HTML5 and CSS. CSS which was completely new – my geocities sites used inline styles – and Ethan Marcotte's book on responsive web design was eye-opening. Lab3D v1 was completed in July 2013 in time to graduate and present the project at the Gordon Research Conference on "Visualization in Science and Education".
2After completing the v1 of the project in 2013 it was clear that the current approach of adding and displaying chemical data was not very robust. For every new reaction I would need to copy template HTML markup and manually enter values and links. To solve this, I decide to migrate Lab3D into an Angular app, extracting reaction information into a JSON file. I have to credit local meet-ups, Code School, ngBook and the Angular docs for helping me learn AngularJS. I completed Lab3D v2 in time to present at the 2015 International Conference on Chemistry Education (Figure 2) and have heard since heard from professors that they used the resource in their classroom.
What would I have done next?
To make it a more meaningful resource the reaction library needs to be expanded. The next step would be to set up a database and backend server to enable user contribution of molecular data. Contributing to an online resource of chemical reaction visualizations would be a great project for students studying computational chemistry.